본 게시글의 원문은 Yann Debray의 MATLAB with Python Book 입니다. 해당 책은 MIT 라이센스를 따르기 때문에 개인적으로 번역하여 재배포 합니다. 본 포스팅에는 추후 유료 수익을 위한 광고가 부착될 수도 있습니다.
MIT License

Copyright (c) 2023 Yann Debray

Permission is hereby granted, free of charge, to any person obtaining a copy
of this software and associated documentation files (the "Software"), to deal
in the Software without restriction, including without limitation the rights
to use, copy, modify, merge, publish, distribute, sublicense, and/or sell
copies of the Software, and to permit persons to whom the Software is
furnished to do so, subject to the following conditions:

The above copyright notice and this permission notice shall be included in all
copies or substantial portions of the Software.

THE SOFTWARE IS PROVIDED "AS IS", WITHOUT WARRANTY OF ANY KIND, EXPRESS OR
IMPLIED, INCLUDING BUT NOT LIMITED TO THE WARRANTIES OF MERCHANTABILITY,
FITNESS FOR A PARTICULAR PURPOSE AND NONINFRINGEMENT. IN NO EVENT SHALL THE
AUTHORS OR COPYRIGHT HOLDERS BE LIABLE FOR ANY CLAIM, DAMAGES OR OTHER
LIABILITY, WHETHER IN AN ACTION OF CONTRACT, TORT OR OTHERWISE, ARISING FROM,
OUT OF OR IN CONNECTION WITH THE SOFTWARE OR THE USE OR OTHER DEALINGS IN THE
SOFTWARE.
본 게시물에서 활용된 소스 코드들은 모두 Yann Debray의 GitHub Repo에서 확인할 수 있습니다.
4.7. Python과 MATLAB 간의 데이터 매핑
Python for MATLAB Development이라는 책에서 Albert Danial은 mat2py를 사용하여 MATLAB 변수를 해당하는 Python 기본 변수로 변환하는 똑똑한 함수와 py2mat을 사용하여 반대로 수행하는 함수를 공유합니다.
MATLAB 함수 내에서 반환된 Python 함수의 데이터 변환은 두 언어의 기본 데이터 유형의 차이를 이해해야 할 수도 있습니다:
- 스칼라(정수, 부동 소수점 숫자 등), 텍스트 및 부울 값
- 딕셔너리(dictionary) 및 리스트(list)
- 배열(array) 및 데이터프레임(dataframe)
타임테이블 또는 카테고리와 같은 일부 특수한 MATLAB 데이터 유형은 추가 처리가 필요하며 수동으로 변환되어야 할 수 있습니다. 물론 이러한 데이터 유형을 여전히 함수에서 사용할 수는 있지만, 함수는 Python 인터프리터가 이해할 수 있는 유형을 반환해야 합니다.
4.7.1. 스칼라(Scalars)
아래 표는 일반적인 스칼라 데이터 유형의 매핑을 보여줍니다:
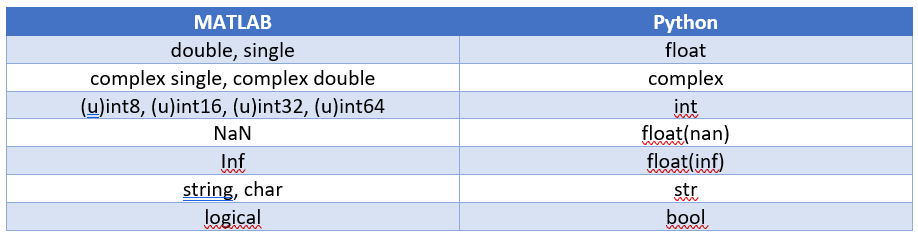
기본적으로 MATLAB에서 숫자는 double 형태이며, Python에서 소수점 없는 숫자는 정수 형태입니다.
a = py.dataExchange.get_float()
a = 1
class(a)
ans = 'double'
b = py.dataExchange.get_complex()
b = 2.0000 + 0.0000i
class(b)
ans = 'double'
MATLAB에는 요구되는 정밀도에 따라 여러 유형의 정수가 있습니다.
예를 들어, uint8은 0과 255 사이의 양수만 저장할 수 있으며, int8은 [-2^7, 2^7-1] 범위를 다룹니다.
Python 정수를 변환하는 가장 일반적인 유형은 int64입니다. 이를 명시적으로 수행할 수 있습니다.
c = py.dataExchange.get_integer()
c =
  Python int with properties:

    denominator: [1x1 py.int]
           imag: [1x1 py.int]
      numerator: [1x1 py.int]
           real: [1x1 py.int]

    3
class(c)
ans = 'py.int'
int64(c)
ans = 3
Python 함수에서 문자열을 가져올 때 변환은 명확하지 않을 수 있습니다. 이를 char (문자 배열)이나 string으로 변환할 수 있습니다.
char의 경우 작은따옴표로, string의 경우 큰따옴표로 구분할 수 있습니다.
abc = py.dataExchange.get_string()
abc =
  Python str with no properties.

    abc
char(abc)
ans = 'abc'
class(char(abc))
ans = 'char'
string(abc)
ans = "abc"
class(string(abc))
ans = 'string'
마지막으로, 논리 정보를 포함하는 기본 데이터 유형은 Python에서 불리언(boolean)이라고 불립니다.
py.dataExchange.get_boolean()
ans =
   1
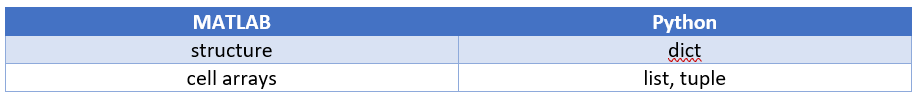
4.7.2. 딕셔너리(Dictionaries)과 리스트(Lists)
다음은 두 언어 간에 컨테이너가 어떻게 매핑되는지를 나타내는 내용입니다:
Python 딕셔너리와 리스트를 MATLAB 컨테이너로 변환하는 예를 제시하기 위해 2장의 예제를 다시 사용해 보겠습니다.
JSON 데이터는 Python의 딕셔너리와 매우 유사하며, 웹 서비스에서 데이터에 접근할 때 데이터 처리가 매우 쉬워집니다.
url = webread("https://samples.openweathermap.org").products.current_weather.samples{1};
r = py.urllib.request.urlopen(url).read();
json_data = py.json.loads(r);
py.weather.parse_current_json(json_data)
ans =
  Python dict with no properties.

    {'temp': 280.32, 'pressure': 1012, 'humidity': 81, 'temp_min': 279.15, 'temp_max': 281.15, 'speed': 4.1, 'deg': 80, 'lon': -0.13, 'lat': 51.51, 'city': 'London', 'current_time': '2022-05-22 22:15:18.161296'}
딕셔너리는 스칼라 뿐만 아니라 리스트와 같은 다른 데이터 유형도 포함할 수 있습니다.
url2 = webread("https://samples.openweathermap.org").products.forecast_5days.samples{1};
r2 = py.urllib.request.urlopen(url2).read();
json_data2 = py.json.loads(r2);
forecast = struct(py.weather.parse_forecast_json(json_data2))
forecast =
    current_time: [1x40 py.list]
            temp: [1x40 py.list]
             deg: [1x40 py.list]
           speed: [1x40 py.list]
        humidity: [1x40 py.list]
        pressure: [1x40 py.list]
forecastTemp = forecast.temp;
forecastTime = forecast.current_time;
숫자 데이터만 포함하는 리스트는 MATLAB R2022a부터는 doubles로 변환할 수 있습니다:
double(forecastTemp)
ans = 1x40
  261.4500  261.4100  261.7600  261.4600  260.9810  262.3080  263.7600  264.1820  264.6700  265.4360  266.1040  266.9040  268.1020  270.2690  270.5850  269.6610  269.1550  268.0560  265.8030  263.3810  261.8500  263.4550  264.0150  259.6840  255.1880  255.5940  256.9600  258.1090  259.5330  263.4380  264.2280  261.1530  258.8180  257.2180  255.7820  254.8190  257.4880  259.8270  261.2560  260.2600
그리고 어떤 종류의 리스트든 문자열로 변환할 수 있습니다 (텍스트와 숫자 데이터의 혼합을 포함한 경우도).
forecastTimeString = string(forecastTime);
datetime(forecastTimeString)
ans = 1x40 datetime
30-Jan-2017 18:00:0030-Jan-2017 21:00:0031-Jan-2017 00:00:0031-Jan-2017 03:00:0031-Jan-2017 06:00:0031-Jan-2017 09:00:0031-Jan-2017 12:00:0031-Jan-2017 15:00:0031-Jan-2017 18:00:0031-Jan-2017 21:00:0001-Feb-2017 00:00:0001-Feb-2017 03:00:0001-Feb-2017 06:00:0001-Feb-2017 09:00:0001-Feb-2017 12:00:0001-Feb-2017 15:00:0001-Feb-2017 18:00:0001-Feb-2017 21:00:0002-Feb-2017 00:00:0002-Feb-2017 03:00:0002-Feb-2017 06:00:0002-Feb-2017 09:00:0002-Feb-2017 12:00:0002-Feb-2017 15:00:0002-Feb-2017 18:00:0002-Feb-2017 21:00:0003-Feb-2017 00:00:0003-Feb-2017 03:00:0003-Feb-2017 06:00:0003-Feb-2017 09:00:00
R2022a 이전에는 Python 리스트를 MATLAB cell 배열로 변환해야 했습니다.
그런 다음 cellfun 함수로 셀을 double, 문자열로 변환할 수 있습니다.
R2021b까지는 이전 코드는 다음과 같을 것입니다:
forecastTempCell = cell(forecastTemp)
| 1 | 2 | 3 | 4 | 5 | 6 | 7 | 8 | 9 | 10 | 11 | 12 | 13 | 14 | 15 | 16 | 17 | 18 | 19 | 20 | 21 | 22 | 23 | 24 | 25 | 26 | 27 | 28 | 29 | 30 | |
|---|---|---|---|---|---|---|---|---|---|---|---|---|---|---|---|---|---|---|---|---|---|---|---|---|---|---|---|---|---|---|
| 1 | 261.4500 | 261.4100 | 261.7600 | 261.4600 | 260.9810 | 262.3080 | 263.7600 | 264.1820 | 264.6700 | 265.4360 | 266.1040 | 266.9040 | 268.1020 | 270.2690 | 270.5850 | 269.6610 | 269.1550 | 268.0560 | 265.8030 | 263.3810 | 261.8500 | 263.4550 | 264.0150 | 259.6840 | 255.1880 | 255.5940 | 256.9600 | 258.1090 | 259.5330 | 263.4380 |
cellfun(@double,forecastTempCell)
ans = 1x40
  261.4500  261.4100  261.7600  261.4600  260.9810  262.3080  263.7600  264.1820  264.6700  265.4360  266.1040  266.9040  268.1020  270.2690  270.5850  269.6610  269.1550  268.0560  265.8030  263.3810  261.8500  263.4550  264.0150  259.6840  255.1880  255.5940  256.9600  258.1090  259.5330  263.4380  264.2280  261.1530  258.8180  257.2180  255.7820  254.8190  257.4880  259.8270  261.2560  260.2600
forecastTimeCell = cell(forecastTime)
| 1 | 2 | 3 | 4 | 5 | 6 | 7 | 8 | 9 | 10 | 11 | 12 | 13 | 14 | 15 | 16 | 17 | 18 | 19 | 20 | 21 | 22 | 23 | 24 | 25 | 26 | 27 | 28 | 29 | 30 | ||
|---|---|---|---|---|---|---|---|---|---|---|---|---|---|---|---|---|---|---|---|---|---|---|---|---|---|---|---|---|---|---|---|
| 1 | 1x19 str | 1x19 str | 1x19 str | 1x19 str | 1x19 str | 1x19 str | 1x19 str | 1x19 str | 1x19 str | 1x19 str | 1x19 str | 1x19 str | 1x19 str | 1x19 str | 1x19 str | 1x19 str | 1x19 str | 1x19 str | 1x19 str | 1x19 str | 1x19 str | 1x19 str | 1x19 str | 1x19 str | 1x19 str | 1x19 str | 1x19 str | 1x19 str | 1x19 str | 1x19 str | 1x19 str |
cellfun(@string,forecastTimeCell)
ans = 1x40 string
"2017-01-30 18:0…  "2017-01-30 21:0…  "2017-01-31 00:0…  "2017-01-31 03:0…  "2017-01-31 06:0…  "2017-01-31 09:0…  "2017-01-31 12:0…  "2017-01-31 15:0…  "2017-01-31 18:0…  "2017-01-31 21:0…  "2017-02-01 00:0…  "2017-02-01 03:0…  "2017-02-01 06:0…  "2017-02-01 09:0…  "2017-02-01 12:0…  "2017-02-01 15:0…  "2017-02-01 18:0…  "2017-02-01 21:0…  "2017-02-02 00:0…  "2017-02-02 03:0…  "2017-02-02 06:0…  "2017-02-02 09:0…  "2017-02-02 12:0…  "2017-02-02 15:0…  "2017-02-02 18:0…  "2017-02-02 21:0…  "2017-02-03 00:0…  "2017-02-03 03:0…  "2017-02-03 06:0…  "2017-02-03 09:0…
4.7.3. 배열
weather 모듈의 parse_forecast_json 함수를 수정함으로써 리스트 대신 Python 배열을 출력할 수 있습니다.
실제로 기본 Python에는 원시 배열 데이터 형식이 존재합니다.
forecast2 = struct(py.weather.parse_forecast_json2(json_data2))
forecast2 =
    current_time: [1x40 py.list]
            temp: [1x1 py.array.array]
             deg: [1x1 py.array.array]
           speed: [1x1 py.array.array]
        humidity: [1x1 py.array.array]
        pressure: [1x1 py.array.array]
MATLAB의 double 함수는 Python 배열을 MATLAB 배열로 변환합니다.
double(forecast2.temp)
ans = 1x40
  261.4500  261.4100  261.7600  261.4600  260.9810  262.3080  263.7600  264.1820  264.6700  265.4360  266.1040  266.9040  268.1020  270.2690  270.5850  269.6610  269.1550  268.0560  265.8030  263.3810  261.8500  263.4550  264.0150  259.6840  255.1880  255.5940  256.9600  258.1090  259.5330  263.4380  264.2280  261.1530  258.8180  257.2180  255.7820  254.8190  257.4880  259.8270  261.2560  260.2600
이 데이터 변환은 Numpy 배열에도 적용됩니다.
npA = py.numpy.array([1,2,3;4,5,6;7,8,9])
npA =
  Python ndarray:

     1     2     3
     4     5     6
     7     8     9

    Use details function to view the properties of the Python object.

    Use double function to convert to a MATLAB array.
double(npA)
ans = 3x3
     1     2     3
     4     5     6
     7     8     9
4.7.4. 데이터프레임
데이터 전송에 대한 일반적인 질문 중 하나는 MATLAB 테이블과 Pandas 데이터프레임 간의 데이터 교환 방법입니다. 이에 대한 권장 솔루션은 Parquet 파일을 활용하는 것입니다. Parquet은 열 지향 저장 형식으로, 다양한 언어 간에 탭ular 데이터를 저장하고 전송하는 데 사용됩니다. 이는 Hadoop 빅 데이터 생태계의 프로젝트에서 데이터 처리 프레임워크, 데이터 모델 또는 프로그래밍 언어 선택에 관계없이 사용할 수 있습니다. (Parquet에 대해 더 알아보기)
아래 예제는 Pandas 데이터프레임과 MATLAB 테이블 간의 상호 작용을 보여줍니다.
pq_CreateDataFrame.py
import pandas as pd
import numpy as np

# 데이터프레임 생성
df = pd.DataFrame({'column1': [-1, np.nan, 2.5],
'column2': ['foo', 'bar', 'tree'],
'column3': [True, False, True]})
print(df)

# pyarrow 라이브러리를 통해 데이터프레임을 Parquet 파일로 저장
df.to_parquet('data.parquet', index=False)
이 코드는 Python 스크립트로 작성되어 있으며, 데이터프레임을 생성하고 Parquet 파일로 저장하는 과정을 나타냅니다.
Parquet 파일 읽기
% info = parquetinfo('data.parquet')
data = parquetread('data.parquet')
| column1 | column2 | column3 | |
|---|---|---|---|
| 1 | -1 | “foo” | 1 |
| 2 | NaN | “bar” | 0 |
| 3 | 2.5000 | “tree” | 1 |
특정 열의 데이터 타입 확인
class(data.column2)
ans = 'string'
테이블 내 데이터 변경
data.column2 = ["orange"; "apple"; "banana"];
결과를 다시 Parquet로 쓰기
parquetwrite('newdata.parquet', data)
마지막으로 수정된 데이터프레임을 Python에서 다시 읽기:
pq_ReadTable.py
import pandas as pd
import os

# change to current directory
thisDirectory = os.path.dirname(os.path.realpath(__file__))
os.chdir(thisDirectory)
# read parquet file via pyarrow library
df = pd.read_parquet('newdata.parquet')
print(df)